

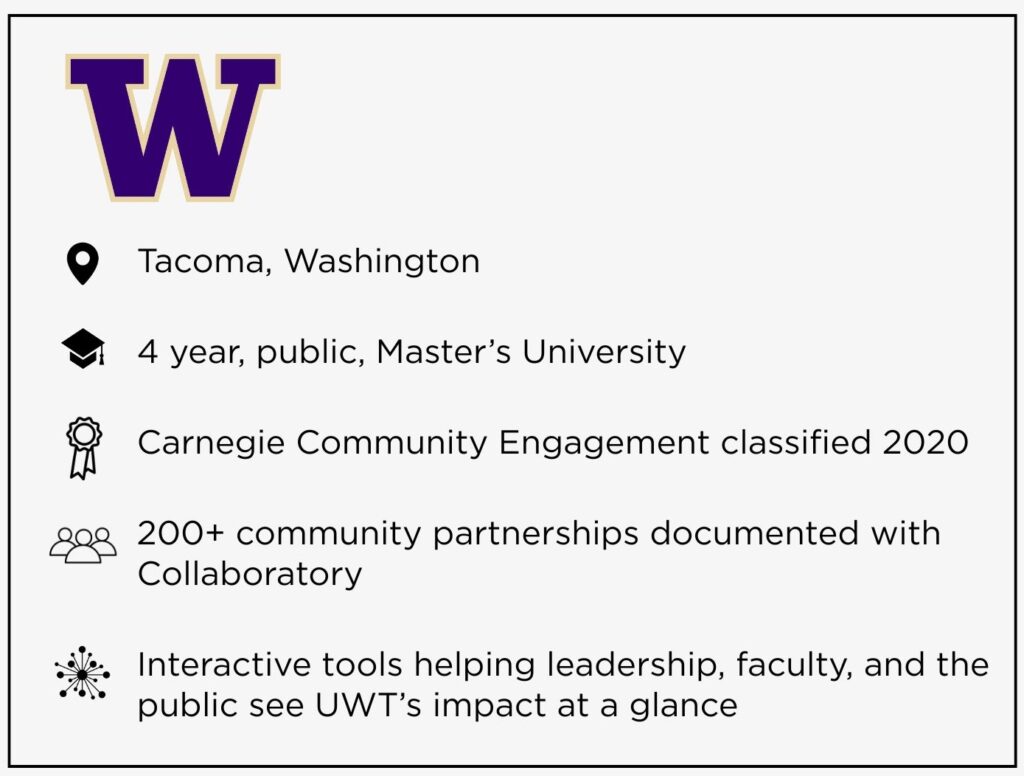
The University of Washington Tacoma (UWT) leverages Collaboratory to track, analyze, and visually communicate its engagement impact.
As a university that prioritizes meaningful, reciprocal relationships with local organizations, UWT needed a way to ensure its community partnerships were not only measurable but also compellingly presented to key stakeholders.
By integrating Collaboratory data into powerful visual dashboards, UWT is bringing community engagement to life in ways that drive decision-making and foster deeper collaboration.
The Challenge
UWT faced a challenge common among engaged institutions: how to make community engagement data meaningful and accessible. While Collaboratory provided a comprehensive system for tracking engagement, the university sought to take this a step further, transforming raw data into visually compelling narratives. To maximize impact, UWT needed an innovative way to engage internal and external audiences—including faculty, staff, leadership, funders, and community partners—by turning data into actionable insights.
The Solution
By utilizing Collaboratory data to create tailored, interactive visualizations, UWT has created a suite of tools that enhance transparency, engagement, and strategic planning:
- Identifying Long-term Partnerships
A sunburst visualization tool highlights the ten longest-standing relationships UWT maintains with external community partners, offering a clear picture of institutional commitment and sustained impact. Partners with a higher number of activities are displayed with bigger circles. Partners that have been working with UWT for longer periods of time are closer to the center. - A Network of Partner Connectivity
A dynamic node diagram visualizes the interconnectedness of UWT’s external partnerships, illustrating how faculty, staff, and students engage with shared partners across various initiatives. - Campus Units’ Engagement across Key Focus Areas
A radar chart provides insight into how different campus units align their engagement efforts with institutional priorities and community needs, ensuring a strategic approach to partnership development. UWT uses this chart to visualize which focus areas are frequently or infrequently addressed.
“Data visualization is transforming the way we understand and communicate community engagement at UW Tacoma. With Collaboratory data, we can make our engagement efforts visible, accessible, and actionable for both internal and external stakeholders.”
Dr. Ali Modarres
Assistant Chancellor for Community Partnerships
The Outcome
With Collaboratory and its innovative data visualization approach, UWT has successfully enhanced the way it tracks and communicates its community engagement impact. These interactive tools have:
- Increased transparency, allowing faculty, staff, and leadership to see engagement efforts in real time.
- Strengthened community relationships, as partners can now better understand UWT’s commitment and alignment with local priorities.
- Informed strategic decision-making, enabling the university to identify gaps, allocate resources more effectively, and tell a more compelling engagement story to funders and stakeholders.
Discover the Power of Data
Unlock the full potential of your engagement efforts. Schedule a demo today and explore the possibilities!