

By: Dr. Kristin Norris, Indiana University-Purdue University Indianapolis
Every once in a while, we are asked a seemingly simple question – “where is IUPUI engaged?” It seems like a very simple question . . . unless you are intimately familiar with the variety of ways in which your university collects information. However, it was extremely difficult and complex to answer…until now.
I’d like to share our experiences with those who are responsible for advancing community engagement or collecting and reporting on campus-community partnerships. As a field, we need more dialogue about how to leverage existing data collection systems and processes (e.g., faculty annual reports, co-curricular engagement tools, community-engaged learning courses, IRB protocol, contracts and grants).
In the past, the best answer I could give to the “where” question was a list of community partner organizations that faculty worked with through their service-learning or community-engaged learning courses. The annual process of identifying courses had its limitations, but knowing where the partners were located was even more complicated. Cleaning the list of organizations, removing duplicates, correcting for the proper name of an organization and figuring out what to do when an organization had multiple locations was tedious and imperfect. To be clear, answering that question prior to having Collaboratory® was painful and almost impossible.
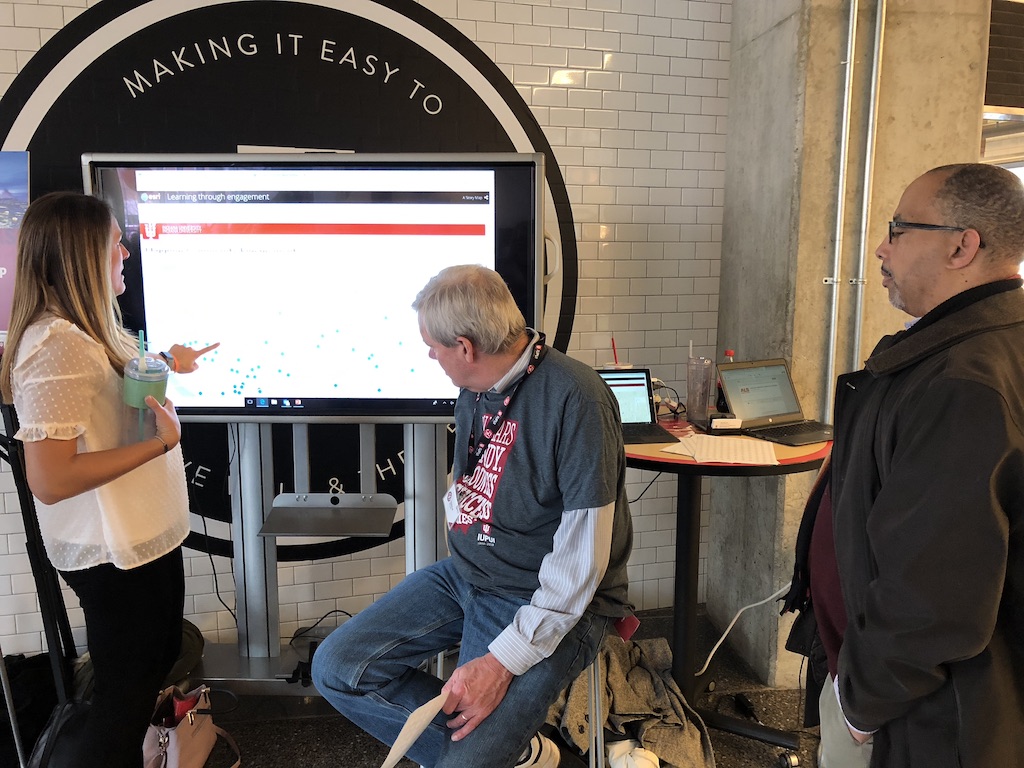
Core Collaboratory Administrator, Dr. Kristin Norris demonstrates the IUPUI engagement map.
Leveraging Collaboratory
By 2018, we had enough campus-wide participation in Collaboratory that we could really begin to leverage its full power. We saw faculty/staff participation and interest in Collaboratory increase when they understood how the information could be useful to them, the community, and the institution. So instead of being reactive or simply unable to answer the ‘where’ question, we saw an opportunity to validate the work of engaged scholars and practitioners in a new way.
We started by forming an advisory committee made up of faculty, staff and administrators from around the campus with expertise in campus-community partnerships as well as geo-location, data visualization, and informatics. The advisory group developed “use cases” for a map of community engagement that captured reasons why people have been asking us about where IUPUI is engaged.
We wanted to know:
- What would people do with this information?
- What are they trying to understand?
- How would this contribute to informed decision-making?
- How do we make sure it’s more than for communications or public relations?
In the end, we determined that a map of community engagement gives the campus new ways to use geography in the process of understanding the level of engagement, the impact of that engagement, and opportunities for being more strategic about engagement.
Use Cases for Mapping Engagement
I am a … | I want to … | So that I can … |
Campus Leader |
Demonstrate IUPUI’s work in funder’s priority areas (geo or topic)
|
Attract funders; Map by social issues; chart by social issues |
|---|---|---|
Campus Leader | Show others how IUPUI is engaged with the community to address pressing community needs | Demonstrate the value of IUPUI (e.g., workforce development, economic development, addressing social issues) to community leaders and elected officials |
Campus Leader | Identify where IUPUI has (or doesn’t have) a presence
| Identify gaps in the community where we have an opportunity to do more |
Department leaders or committees | Share current data about community engagement activities | Inform department planning and strategies (e.g., curriculum development, research agendas, recruit new faculty) |
Campus leader,
faculty member,
staff member | Identify and bring together people working in the same neighborhood, with the same community partners, and/or on the same issue |
Facilitate partnerships and multidisciplinary approaches;
Develop strategies for more impactful engagement with the community |
Faculty and staff | See a graphic representation of pressing community issues | Identify potential community partners and geographic areas for community-engaged research, service projects, service learning classes, etc. (leveraging both Collaboratory and other public data sources) |
Staff member (Dean’s assistant, communications officer, development officer) | See community engaged activities for my unit | Create an infographic rather than a list to: Write a grant; Compile ad hoc reports (e.g., # of type of partners, student service hours, funding)
Visualize a compelling story of engagement |
Student organization | See a graphic representation of pressing community issues | Align service projects with pressing community issues; Identify potential community and campus partners (e.g., other student organizations); Identify potential volunteer locations |
Community Organization, elected official, engaged resident, neighborhood associations | Find faculty and staff engaged with my community who have interests that align with my needs; See all the projects that my organization is doing with IUPUI | To have a more user friendly means of connecting with campus partners; Understand how IUPUI is engaging with the community; Be more strategic with my engagement with IUPUI |
Office of Community Engagement | Demonstrate the value of collecting community engagement data | Create demand for Collaboratory |
Reflections as a Collaboratory Administrator
The Good News – IUPUI’s community engagement map created a powerful motivator for people to get their information into Collaboratory…beyond what I could have imagined. Having an activity in Collaboratory is different than being visually represented on a map. Searching Collaboratory requires initiative…a map inspires curiosity.
The Challenge – Geo-location is not without challenges. Collaboratory tracks location information in two valuable ways: 1) Where engagement took place (if applicable) and 2) The location of community organizations/partners (which could include multiple partners for one activity). The role of data visualization (in this case, a pin on a map) and what it represents (i.e., activity, partner, relationships) is worthy of meaningful consideration.
A Word of Caution – Mapping engagement does not mean “impact” and we should all be cautious of how the information may be misinterpreted. IUPUI’s map uses Collaboratory data to populate it and other public information including an assets database. A ‘pin’ on a map does not represent the intended impact.
In summary, I wish that we had more conversations within our field about mapping engagement, which forces us to talk about systems and processes for tracking engagement – what we capture, how and why. Please check out our map and the subsequent ‘story maps’ we’ve created that leverages Collaboratory, the map, and other forms of communications and media to tell the story of “where is IUPUI engaged.” Then, let’s have a conversation …please!!!

Dr. Kristin Norris
Director of Assessment for the Office of Community Engagement at IUPUI.
Kristin works with stakeholders (internal and external) to track community-engaged activities in order to conduct assessment, evaluation, and research that transforms higher education and demonstrates how IUPUI’s community engaged activities (e.g., programs, pedagogies, research, initiatives) support the institutional mission, demonstrate progress toward the strategic plan, and inform decision making. Kristin is passionate about student civic outcomes and the public purpose of higher education in addressing community issues.


